Soccer percentile rankings: compare a player to his position
By Mariano David Pérez Co-founder
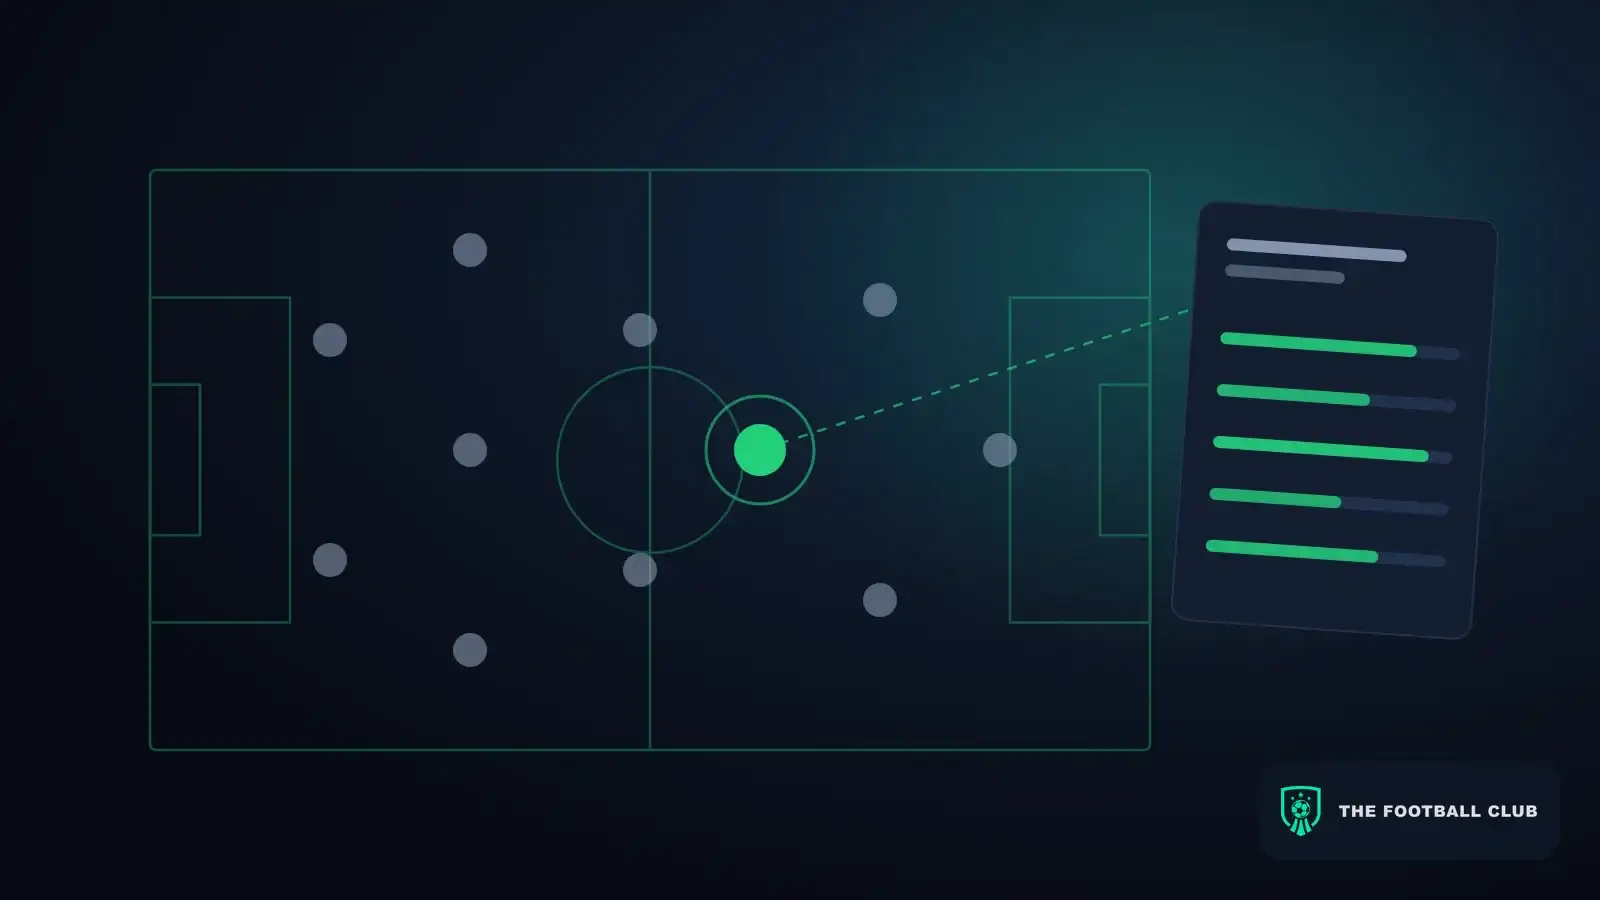
Soccer percentile rankings show where a player sits among others in his position on a given metric: the 80th percentile in progressive passes per 90 minutes means he outperforms 80% of the group he is being compared with. They matter because they turn a number nobody can read (“3.4 per 90”) into a position anyone understands, but they only mean something if the comparison group is honest: same position, similar competitions and enough minutes.
How is a percentile calculated?
Players in the group are sorted by their value on the metric, and you look at what share of the group falls below the player. The statistical definition of percentile rank is exactly that: the percentage of values in the distribution that are lower than the player’s. Where values are tied, the usual formula counts half of the tied values as “below”.
An example with invented numbers: in a group of 200 centre-forwards, a player has 0.45 xG per 90 minutes. 170 centre-forwards have less than him and none are level. His percentile rank is 170 / 200, so the 85th percentile.
Two clarifications that prevent confusion:
- A percentile is not a success rate. The 85th percentile does not mean “85% accuracy”: it means he beats 85% of the group. The definition of a percentile separates the cut-off value (in the metric’s own units) from the percentile rank (a percentage); in soccer people almost always mean the second.
- A percentile orders, it does not measure distance. Two players at the 90th and 91st percentile can be almost level or far apart, depending on how tightly the group is packed at that point. That follows from the definition rather than from any provider’s documentation, which is why you should always look at the raw value next to it.
Who should a player be compared against?
A group defined by three decisions: position, competitions and minutes. Changing any of the three changes the same player’s percentile, with identical numbers.
- Position. Two shots a game is a lot for a centre-back and little for a striker. Providers solve this with position templates: the Hudl Statsbomb radars have one each for goalkeepers, centre-backs, full-backs, midfielders, attacking midfielders or wingers, and strikers, and comparison is made within each group.
- Competitions. Hudl’s guide to benchmarking with Wyscout presents its compare mode as a way to set a player against others in similar positions in the same league, with filters for period and competitions. Comparing a second-division full-back with full-backs from the top five leagues is not wrong, but it answers a different question: “could he make the step?” instead of “how does he perform where he plays?”.
- Minutes. With 150 minutes, a per-90 value is noise: one good game sends it through the roof. Both the player and the comparison group should clear a minimum number of minutes. There is no universal figure; what matters is to set it and say it.
An example of how the group moves the number
The table is illustrative, with invented data, to show the effect of choosing a different group for the same winger:
| Comparison group | Players | Percentile in dribbles completed per 90 |
|---|---|---|
| Wingers in his league, 900 minutes or more | 60 | 88 |
| Wingers in the six leagues, 900 minutes or more | 420 | 61 |
| Wingers in his league, no minutes minimum | 95 | 74 |
No row is “wrong”: each answers something different. What is wrong is quoting the 88 without saying against whom.
Is a percentile radar the same as a percentile?
Not always. Many charts that look like percentiles actually scale the value between a floor and a ceiling. Hudl Statsbomb explains that the boundaries of its radars are set using the top and bottom 5% of production by players in that position across several competitions and seasons, that the data points are calculated per 90 minutes and that defensive stats are possession-adjusted. That is a scale built to keep comparisons stable between competitions, not a ranking inside a single group.
The practical difference: in a percentile the last player in the group sits at 0 and the first at 100 even if they are close; on a scale with fixed floor and ceiling, the distance from the group shows. Check the legend of any chart to see which of the two it is.
Which mistakes make a percentile meaningless?
- Not naming the group. “90th percentile” with no position, competition or minutes cannot be discussed or checked.
- Comparing totals. Totals reward whoever played most. Percentiles should be built on per-90 values, as Hudl Statsbomb’s radars are.
- Averaging percentiles into a single grade. A player at the 95th percentile on one metric and the 15th on another is not “a 55”. Profiles are read metric by metric; the guide to soccer metrics by position explains which ones make sense in each role.
- Reading a defensive metric as if it were only the player’s. Clearances, interceptions and duels depend on how much his team defends; that is why defensive data is possession-adjusted, as Hudl Statsbomb does.
- Mixing sources. A “duel” or a “progressive pass” is not defined the same way by every provider. A percentile from one source is calculated against that same source’s group.
- Ignoring the role. The position on a spreadsheet is not always the one a player occupies on the field. A percentile against the wrong position is the wrong percentile.
- Drawing conclusions from a short spell. A high percentile over a few games can be a streak. It counts for more when it holds across several seasons.
How do you present a percentile to a club?
With the metric, the per-90 value, the percentile, the group and the minutes, all together. Four or five metrics specific to the position, not forty, and the video alongside: the percentile says where a player stands, not why. Why a percentile reads better than a bare number, and which Wyscout data is worth showing, is covered in the note on Wyscout data for agents; and how to combine what the numbers say with what the scout saw is in the soccer scouting report guide.
How this looks in The Football Club
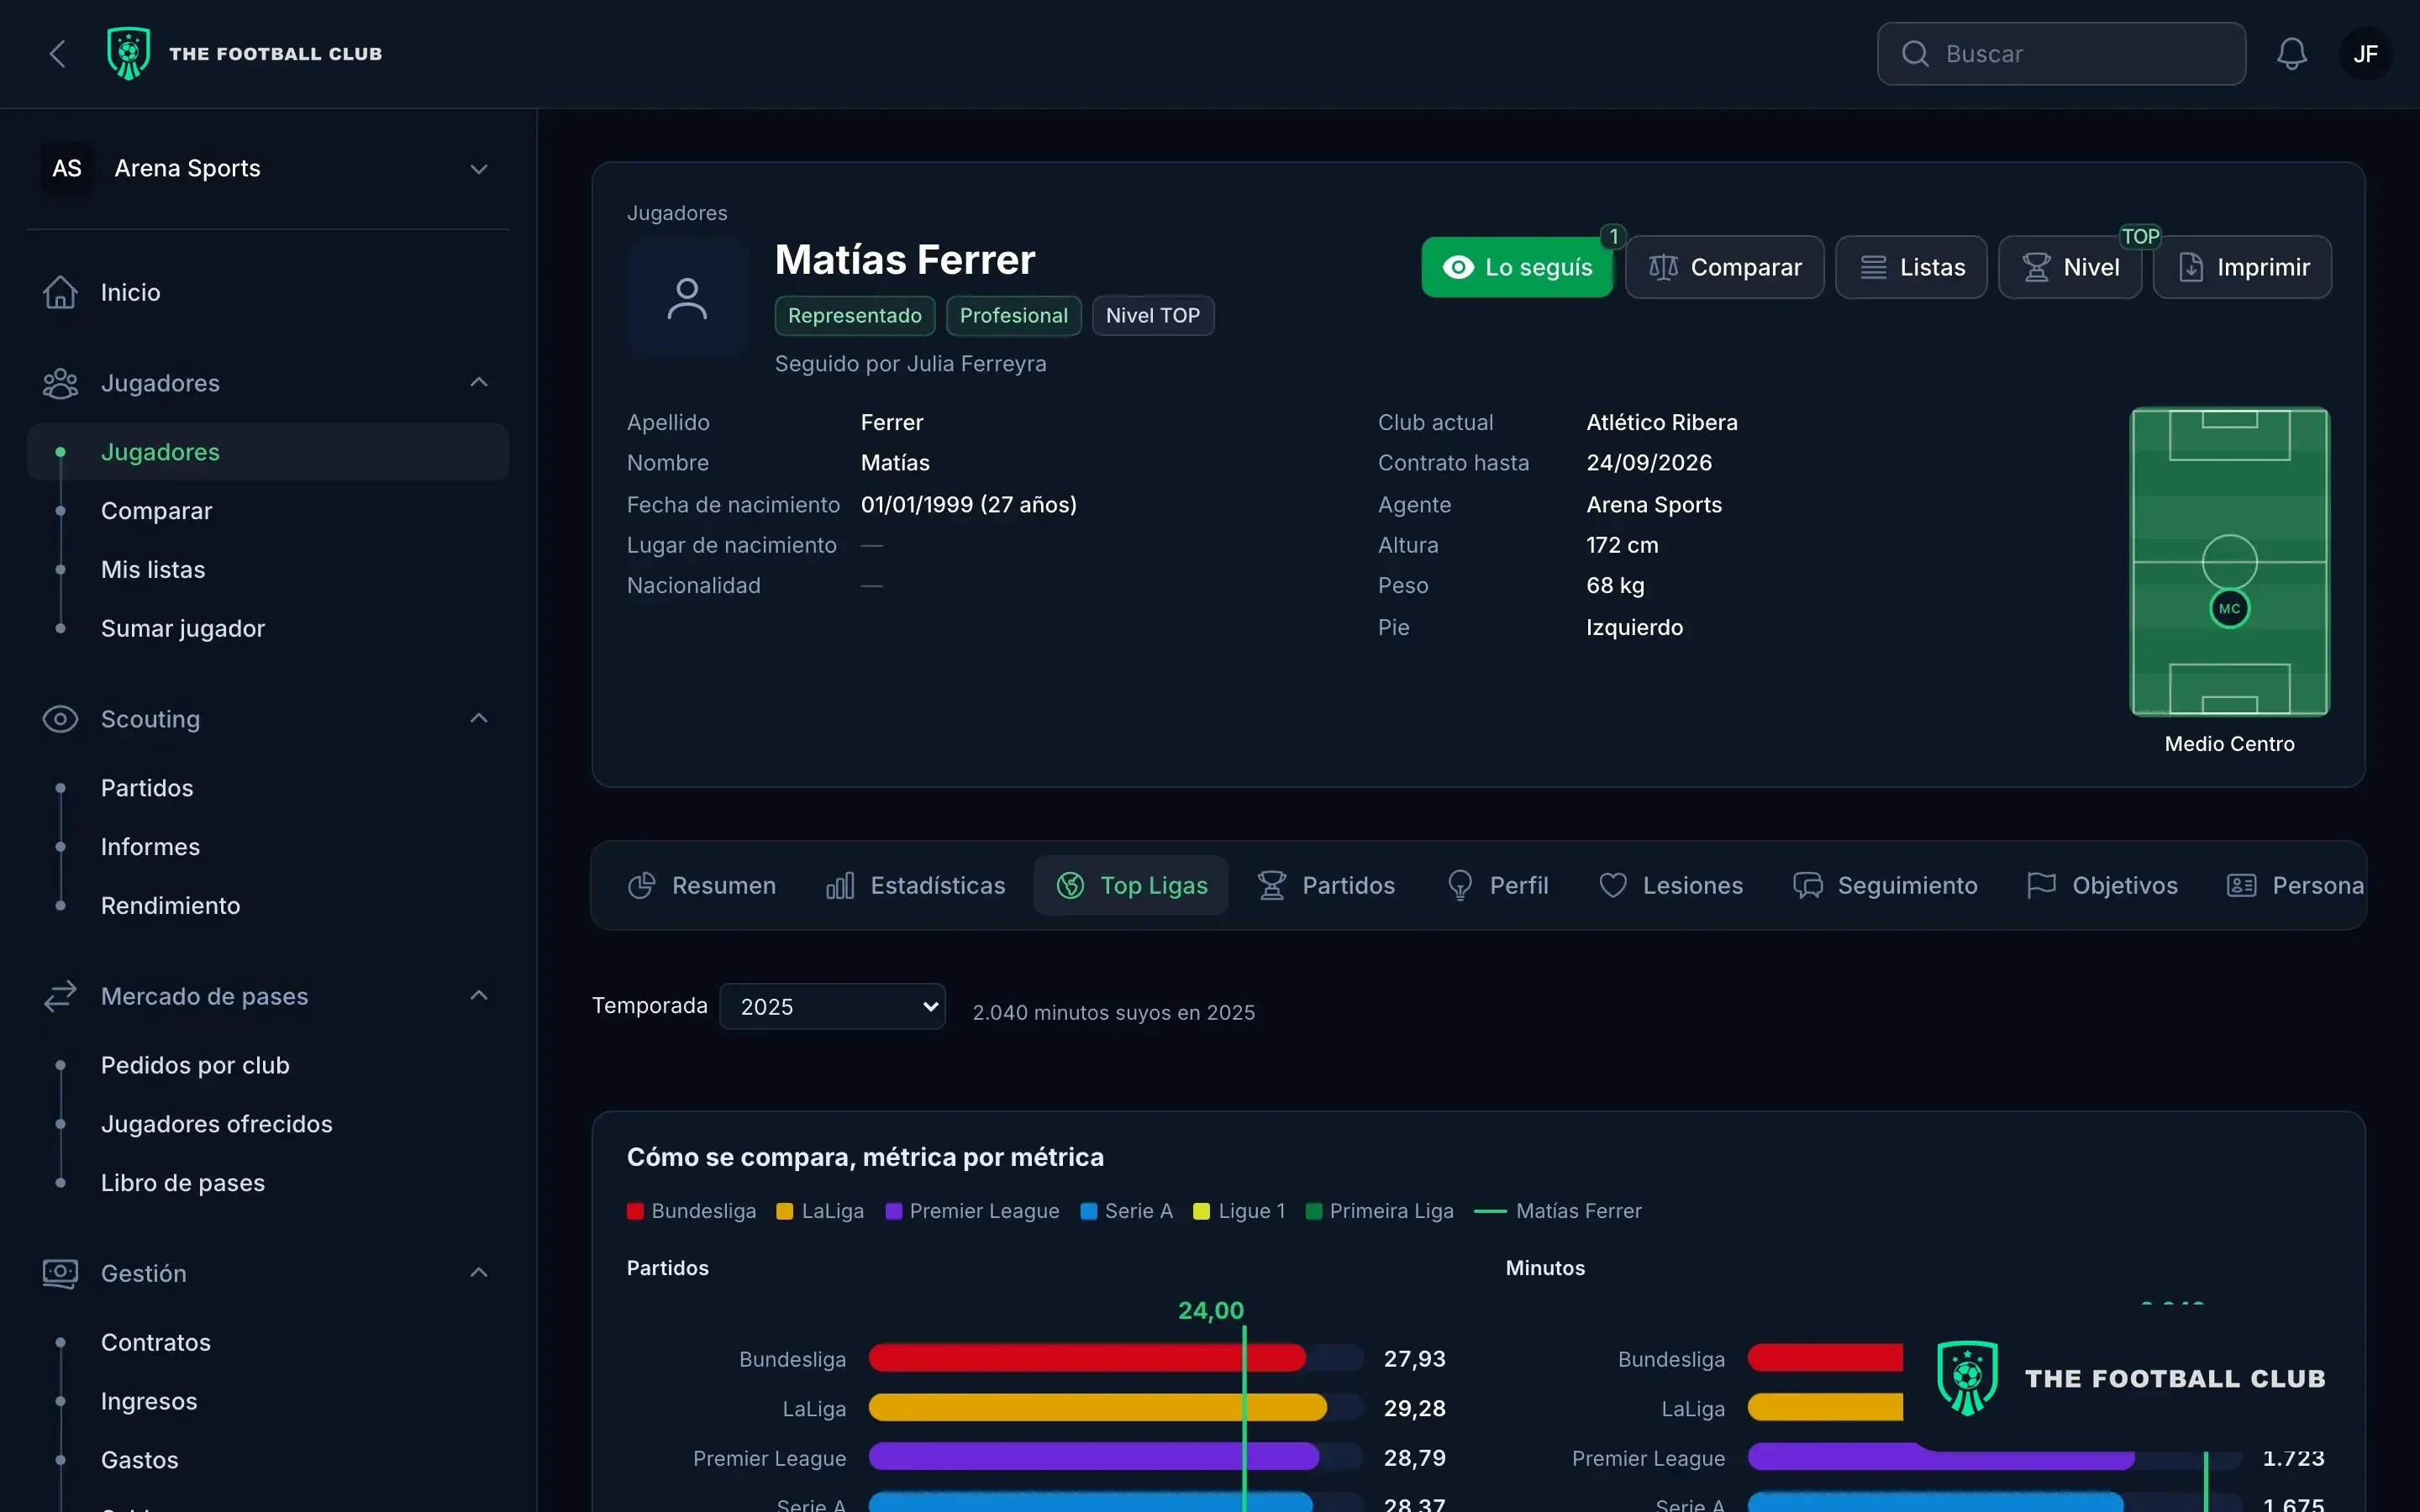
On the player profile, each metric is shown per 90 minutes next to the average for his position in the six best leagues, with the minutes visible: the comparison is always within the position. The Labs blocks aim for every number to be read against players in the same position rather than on its own. If you work with Wyscout, your export lands in the same profile and each block says which source it came from.
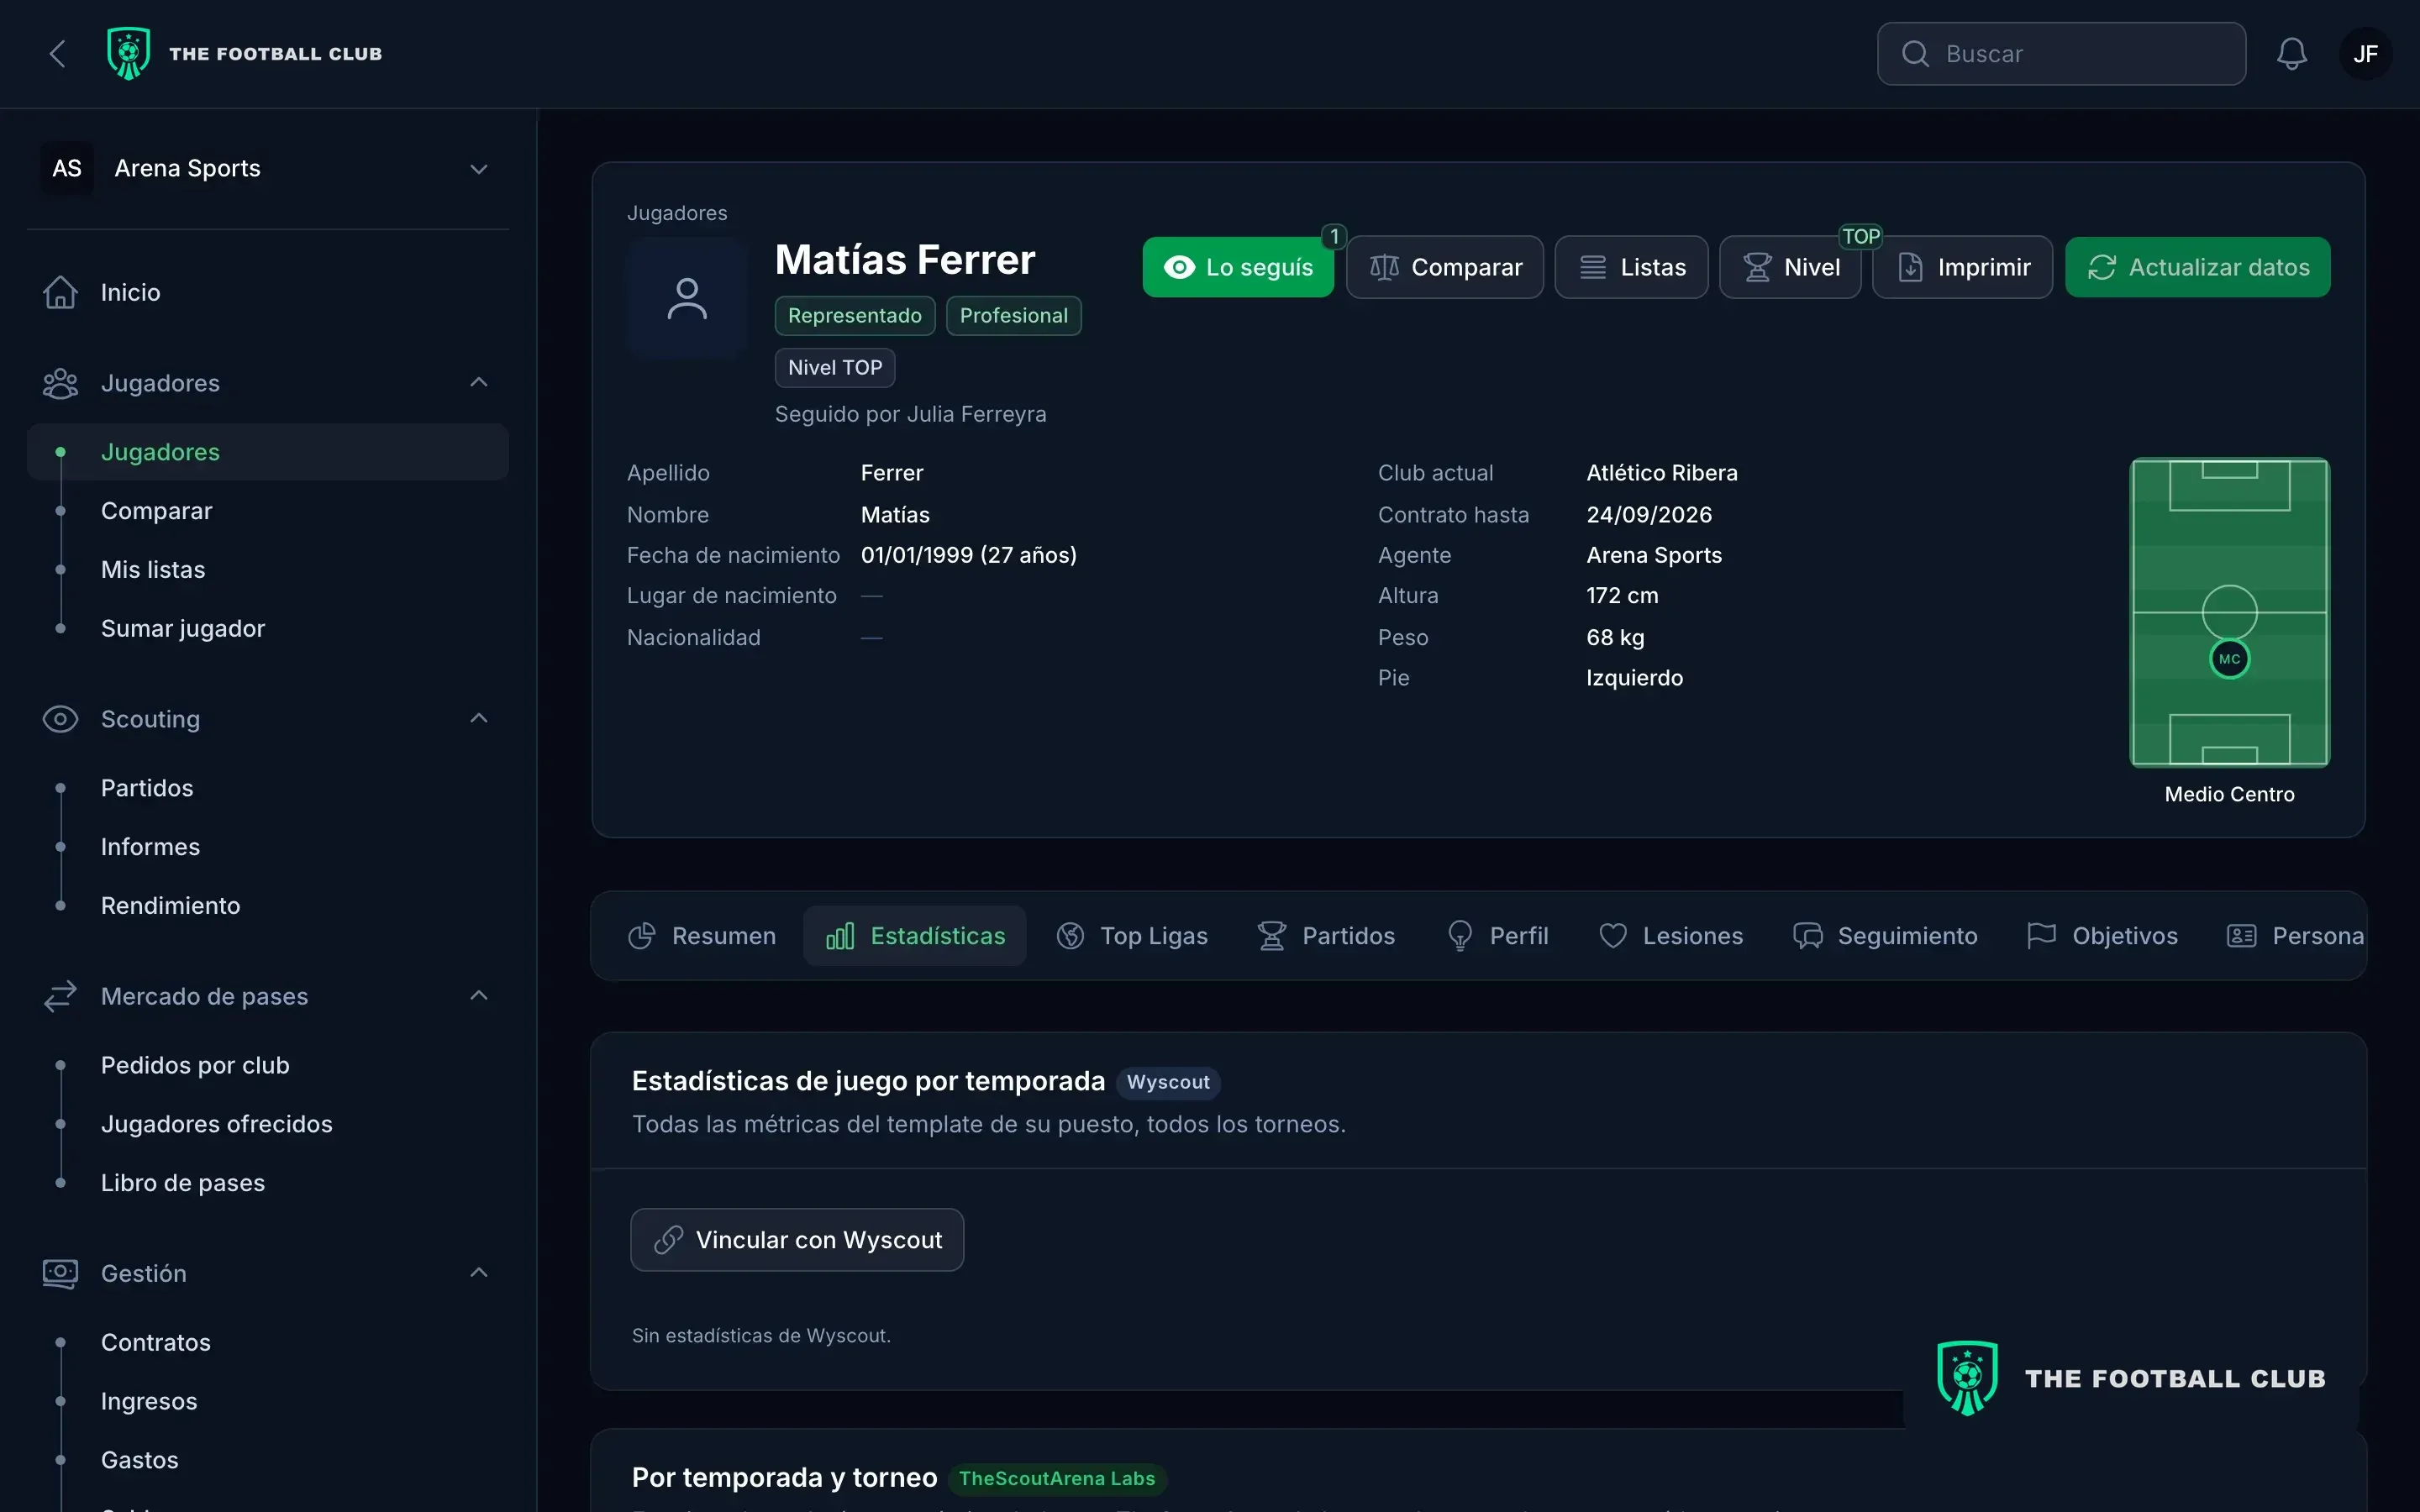
Every game report is filled in with the attributes of the player’s position and stays in the same profile, so the data and the scout’s notes are read together. How a working week with that looks is on the game reports.
In short
A percentile is a player’s position within a group, not a grade. It is useful when the position, competitions and minutes of the group are stated; when it is read per 90 minutes; when it is not averaged; and when it comes with the real value, the video and a report from someone who watched the player. Without that, a 90th percentile is just a well-presented number.
Note updated in November 2026.
Sources
Consulted in November 2026:
- Hudl Statsbomb: New Statsbomb radars: 2023 update, 26 October 2023 (position templates, top and bottom 5% boundaries, per-90 data, possession-adjusted defensive stats).
- Hudl: Benchmarking and monitoring a player portfolio with Wyscout (comparison against players in similar positions in the same league).
- Wikipedia: Percentile rank and Percentile (definitions and handling of ties).